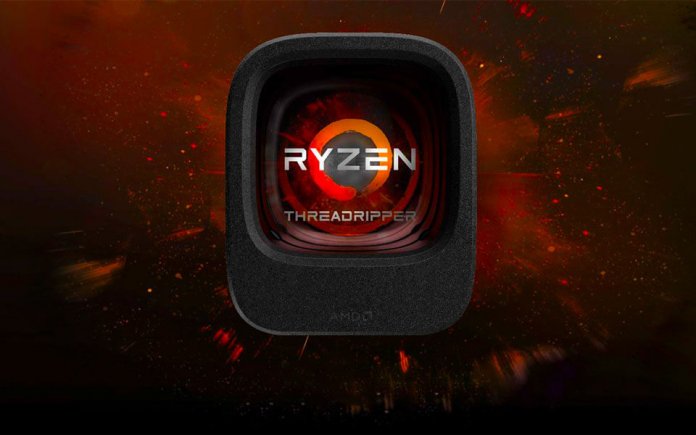
Futuremark has posted a table of performance data for PC processors on its website as of September 2017. The rating is based on the results of testing processors in the 3D Mark program, one of the most famous test programs for personal computers. Although the performance test from the Finnish company is aimed primarily at consumers of computer games, other users can also benefit from this data and determine which processor is best for them personally.
10. AMD Ryzen 7 1700
 3DMark rating: 16290
The processor performance rating opens with a model from AMD released at the beginning of the year from the new Ryzen 7 line under the serial number 1700. Compared to its more powerful counterpart, AMD Ryzen 1700X (the sixth place in the rating), the 1700 version has a lower clock speed (3.0 vs. , 4), but also a smaller thermal package - only 65 W. Interestingly, this is also the most popular processor in the top 10 processors - it was chosen by 4.76% of those who passed the tests. Perhaps due to the fact that with proper overclocking and a certain amount of luck, it can be overclocked to a frequency of 4 GHz, which is comparable in performance to one of the top processors from AMD - Ryzen 1800X (fifth place in the rating).
9.AMD Ryzen 5 1600X
 3DMark rating: 16390
The Ryzen 5 line was announced later than Ryzen 7. It is a more budgetary four- and six-core model designed for gaming and work computers. The Ryzen 5 1600X has a clock speed of 3.6 GHz and Turbo mode is 4.0 GHz. Despite the smaller number of cores, the processors of this line are quite productive due to the frequency potential and the ability to support a large number of computing threads.
8.Intel Core i7-7800X
 3DMark rating: 16580
And here is the first model from Intel in the Futuremark processor rating - a very recently released processor on the Intel X299 platform with Socket LGZ 2066.
The Intel Core i7-7800X has six cores and is capable of running up to 12 threads simultaneously. The new formula for allocating memory per core can reduce the load on the processor, and the high clock speed (up to a maximum of 4 GHz) promises high performance in games.
7.Intel Core i7-6900K
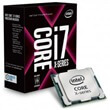 3DMark rating: 17220
Intel's six-core model of the Broadwell-E series of a new microarchitecture is capable of executing up to 16 processes simultaneously thanks to the support of Hyper-Threading technology. The clock speed is 3.2 GHz (up to 4 GHz in Turbo mode). It is not very popular - only 0.2% of those who passed the tests chose this processor. And this can be explained by the fact that the i7-6900K as a flagship outperforms the previous models of the line by only 10%, which can be increased by overclocking. And lovers of powerful systems will prefer to buy new ten- or more nuclear models.
6.AMD Ryzen 7 1700X
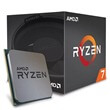 3DMark rating: 17840
The second most popular in the top 10 - the number of Ryzen 7 1700X users accounted for 1.9% of those tested. In terms of frequency, the 1700X differs from its older brother, the fifth place in the rating, it is 3.4 GHz without overclocking and 3.8 GHz with overclocking. Agree, the difference is very small, and at a lower price. One of the best value for money in the rating.
5.AMD Ryzen 7 1800X
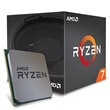 3DMark rating: 18610
Together with the sixth place in the ranking, the Ryzen 7 1700X processor, the AMD Ryzen 7 1800X represents the sweet spot. At a fairly reasonable price of $ 300-400, both processors are among the best options for the latest games.
The processor is clocked at 3.6GHz and can support up to 16 threads simultaneously with Simultaneous Multithreading.And when you turn on the "Turbo" mode, the frequency can be caught up to 4.1 GHz. At the same time, the processor has a very economical power consumption.
4. Intel Core i7-6950X
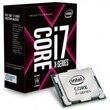 3DMark rating: 19890
Intel's 10-core flagship last year, based on the Broadwell design, can handle up to 20 threads. Its frequency is 3.0 GHz with overclocking capability up to 3.5 GHz. True, overclocking fans will rather be unhappy with it - ten cores plus an increased memory cache can cause the processor to overheat if the frequency exceeds 3.8 GHz. However, this is more than compensated for by the power of this CPU, which, although released last year, is still one of the most productive.
3. Intel Core i7-7820X
3DMark rating: 20960
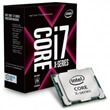 Intel's next-generation octa-core Skylake-X processor supports up to 16 threads. Its base frequency is 3.6 GHz, under the maximum overclocking - 4.5 GHz. True, I had to pay for the increase in performance - the processor is rather gluttonous. It is better to use this CPU in production systems, since during the transition to the new design there was a slight increase in latency when the cores communicate with each other and with memory.
2.Intel Core i9-7900X
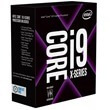 3DMark rating: 25350
Competition with AMD benefited both Intel and users - prices for Intel products decreased, but the number of new technical solutions increased. Summer new from Intel, the flagship 10-core HEDT processor based on the Skylake-X design is capable of running up to 20 threads simultaneously. Its base frequency is 3.3 GHz, the maximum overclocking is up to 4.5 GHz. Intel also updated the core interaction system and completely redesigned caching. However, the rejection of the ring bus had a rather negative effect on the performance in games. But the use of the second generation process (14 nm +) will allow video processing much faster, reducing the time required for this by almost a third.
1.AMD Ryzen Threadripper 1950X
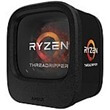 3DMark rating: 25570
According to experts from Futuremark, the dispute between AMD and Intel this year can be completed. The Ryzen model from AMD with the loud and memorable name Threadripper was recognized as the most powerful processor (even if its superiority over the second place in the rating, the process from Intel, is the smallest). This technological marvel is equipped with 16 cores at once and is capable of executing up to 32 threads simultaneously!
This processor is used by only 0.06% of those tested, and no wonder - its price is over a thousand dollars.
Processor performance table 2017
| A place | CPU | Price | Manufacturing capacity | Popularity |
|---|---|---|---|---|
| 1 | AMD Ryzen Threadripper 1950X | $1000 | 25570 | 0.06% |
| 2 | Intel Core i9-7900X | n / a | 25350 | 0.51% |
| 3 | Intel Core i7-7820X | n / a | 20960 | 0.42% |
| 4 | Intel Core i7-6950X | $1775 | 19890 | 0.46% |
| 5 | AMD Ryzen 7 1800X | $465 | 18610 | 1.43% |
| 6 | AMD Ryzen 7 1700X | n / a | 17840 | 1.9% |
| 7 | Intel Core i7-6900K | $1022 | 17220 | 0.2% |
| 8 | Intel Core i7-7800X | n / a | 16580 | 0.25% |
| 9 | AMD Ryzen 5 1600X | n / a | 16390 | 1.32% |
| 10 | AMD Ryzen 7 1700 | $360 | 16290 | 4.76% |
| 11 | Intel Core i7-6850K | $599 | 15480 | 0.65% |
| 12 | AMD Ryzen 5 1600 | n / a | 15200 | 3.77% |
| 13 | Intel Core i7-5960X | $2265 | 14710 | 0.45% |
| 14 | Intel Core i7-6800K | $475 | 14550 | 0.68% |
| 15 | Intel Core i7-7700K | $309 | 13860 | 8.8% |
| 16 | Intel Core i7-5930K | $661 | 13380 | 0.71% |
| 17 | Intel Core i7-4960X | $1354 | 13270 | 0.08% |
| 18 | Intel Core i7-7700 | $310 | 12650 | 1.38% |
| 19 | Intel Core i7-4930K | $649 | 12600 | 0.38% |
| 20 | Intel Core i7-5820K | $384 | 12570 | 1.19% |
| 21 | Intel Core i7-3960X Extreme Edition | $690 | 12440 | 0.13% |
| 22 | Intel Core i7-6700K | $317 | 12320 | 7.41% |
| 23 | Intel Core i7-3930K | $599 | 12220 | 0.42% |
| 24 | AMD Ryzen 5 1500X | $770 | 11490 | 0.43% |
| 25 | Intel Core i7-5775C | $358 | 11030 | 0.12% |
| 26 | Intel Core i7-4790K | $391 | 10680 | 4.88% |
| 27 | AMD Ryzen 5 1400 | n / a | 10590 | 0.55% |
| 28 | Intel Core i7-6700 | $305 | 10210 | 1.26% |
| 29 | Intel Core i7-4790 | $303 | 9510 | 0.81% |
| 30 | Intel Core i7-4820K | $399 | 9220 | 0.15% |
| 31 | Intel Core i7-4770K | $420 | 9200 | 1.59% |
| 32 | Intel Core i7-4770 | $420 | 8880 | 0.51% |
| 33 | Intel Core i7-3770K | $330 | 8720 | 1.62% |
| 34 | AMD FX-9590 | $200 | 8620 | 0.32% |
| 35 | Intel Core i7-3770 | $321 | 8420 | 0.86% |
| 36 | Intel Core i7-4790S | $305 | 8250 | 0.04% |
| 37 | AMD FX-9370 | $190 | 8080 | 0.06% |
| 38 | Intel Core i7-980X | $929 | 7950 | 0.12% |
| 39 | AMD Ryzen 3 1300X | n / a | 7650 | 0.07% |
| 40 | AMD FX-8370 | $185 | 7550 | 0.34% |
| 41 | AMD FX-8370E | $197 | 7550 | 0.07% |
| 42 | Intel Core i7-970 | $650 | 7540 | 0.04% |
| 43 | Intel Core i5-6600K | $217 | 7380 | 2.86% |
| 44 | AMD FX-8350 | $260 | 7370 | 1.78% |
| 45 | Intel Core i3-7350K | $180 | 7030 | 0.09% |
| 46 | AMD FX-4300 | $190 | 7020 | 0.2% |
| 47 | Intel Core i5-6600 | $315 | 6930 | 0.73% |
| 48 | Intel Core i5-6500 | $197 | 6710 | 1.02% |
| 49 | Intel Core i5-4690 | $220 | 6670 | 0.66% |
| 50 | AMD Ryzen 3 1200 | n / a | 6650 | 0.1% |
| 51 | Intel Core i5-4690K | $338 | 6610 | 1.52% |
| 52 | AMD Phenom II X6 1100T | $224 | 6550 | 0.09% |
| 53 | Intel Core i3-7100 | n / a | 6510 | 0.23% |
| 54 | AMD FX-8320 | $130 | 6480 | 0.69% |
| 55 | AMD FX-8320E | $130 | 6480 | 0.23% |
| 56 | Intel Core i5-4670K | $235 | 6480 | 1.14% |
| 57 | Intel Core i5-4670 | $223 | 6480 | 0.37% |
| 58 | Intel Core i3-6300 | $150 | 6370 | 0.09% |
| 59 | AMD Phenom II X6 1090T | $290 | 6340 | 0.16% |
| 60 | Intel Core i5-4590 | $200 | 6300 | 0.56% |
| 61 | Intel Core i7-3820 | $296 | 6240 | 0.22% |
| 62 | Intel Core i3-6100 | $117 | 6210 | 0.4% |
| 63 | AMD FX-8150 | n / a | 6150 | 0.12% |
| 64 | Intel Core i5-3570 | $230 | 6150 | 0.54% |
| 65 | Intel Core i5-3570K | $254 | 6150 | 1.25% |
| 66 | AMD FX-8300 | $700 | 6130 | 0.6% |
| 67 | Intel Core i5-4460 | $179 | 6110 | 0.97% |
| 68 | Intel Core i5-3550 | $238 | 5960 | 0.18% |
| 69 | Intel Core i5-4440 | $189 | 5930 | 0.18% |
| 70 | Intel Core i5-6402P | $190 | 5810 | 0.04% |
| 71 | Intel Core i5-3470 | $205 | 5770 | 0.4% |
| 72 | Intel Core i5-4590S | $209 | 5750 | 0.04% |
| 73 | Intel Core i5-4430 | $196 | 5750 | 0.16% |
| 74 | AMD FX-6350 | $130 | 5660 | 0.16% |
| 75 | Intel Core i5-2500 | $280 | 5660 | 0.43% |
| 76 | Intel Core i5-2500K | $480 | 5660 | 1.24% |
| 77 | Intel Core i5-3350P | $200 | 5580 | 0.06% |
| 78 | Intel Core i5-3450 | $198 | 5580 | 0.11% |
| 79 | Intel Core i5-6400 | $191 | 5580 | 0.6% |
| 80 | AMD Phenom II X6 1055T | $976 | 5500 | 0.16% |
| 81 | AMD FX-8120 | n / a | 5440 | 0.16% |
| 82 | Intel Core i5-3330 | $210 | 5400 | 0.11% |
| 83 | AMD Phenom II X6 1045T | n / a | 5290 | 0.04% |
| 84 | Intel Core i3-4170 | $118 | 5290 | 0.13% |
| 85 | Intel Core i5-2400 | $217 | 5270 | 0.27% |
| 86 | Intel Core i7-960 | $258 | 5220 | 0.06% |
| 87 | Intel Core i5-4570R | n / a | 5190 | 0.06% |
| 88 | Intel Core i5-6500T | n / a | 5130 | 0.04% |
| 89 | Intel Core i7-2700K | $1121 | 5120 | 0.25% |
| 90 | Intel Core i3-4160 | $118 | 5120 | 0.08% |
| 91 | Intel Core i5-2320 | $211 | 5080 | 0.05% |
| 92 | AMD FX-6300 | $165 | 4950 | 1.05% |
| 93 | Intel Core i3-4330 | $144 | 4950 | 0.08% |
| 94 | Intel Core i3-4150 | $520 | 4950 | 0.1% |
| 95 | Intel Core i7-950 | $929 | 4890 | 0.19% |
| 96 | Intel Core i5-2310 | $214 | 4890 | 0.04% |
| 97 | Intel Core 2 Quad Q9650 | $335 | 4870 | 0.07% |
| 98 | Intel Core i7-2600 | $294 | 4840 | 0.6% |
| 99 | Intel Core i7-2600K | $439 | 4840 | 1.01% |
| 100 | AMD Phenom II X4 965 | $160 | 4820 | 0.18% |

